
How to analyze my results and sales
Lectura estimada: 2 minutos
91 views
Colaboradores

The platform provides you with a sales report that allows you to measure the results of your efforts. Additionally, you will see which notifications were most successful, enabling you to optimize your future messages.
- To see the results of your sales, click on the “Summary” option in the main menu.:
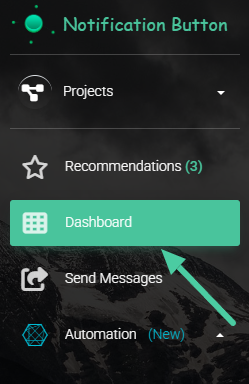
Or log in directly by clicking here.
- You will have access to an overview with activity reports:
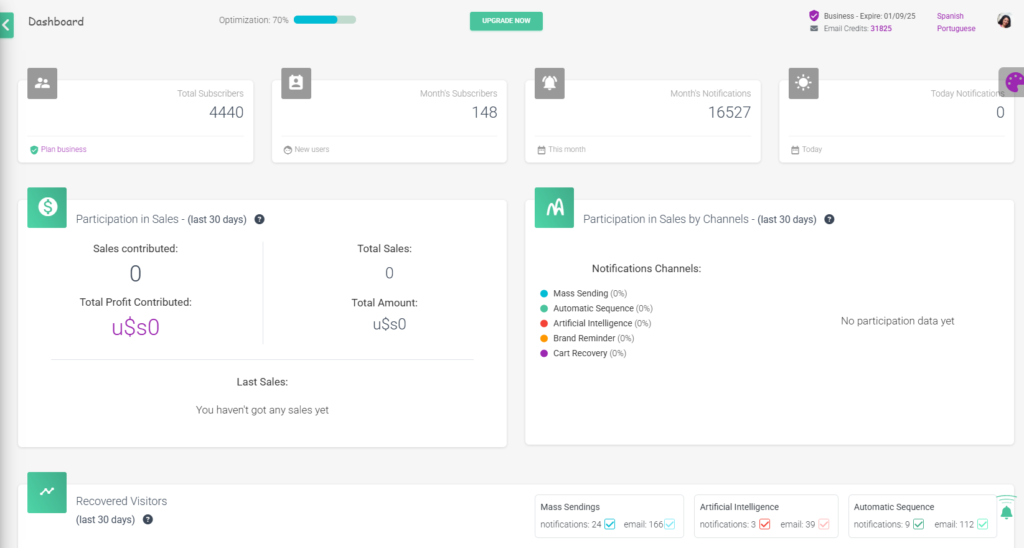
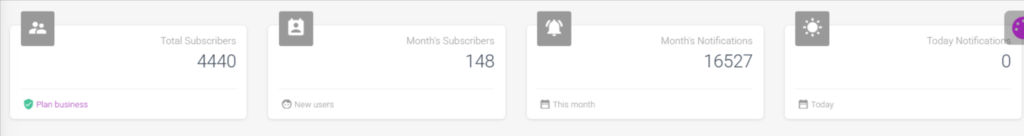
- In the upper left corner, you will see the total number of subscribers to your platform and next to it, the number of people who subscribed in the last month. In the upper right corner, the total number of notifications sent during the last month and on the current day appears:
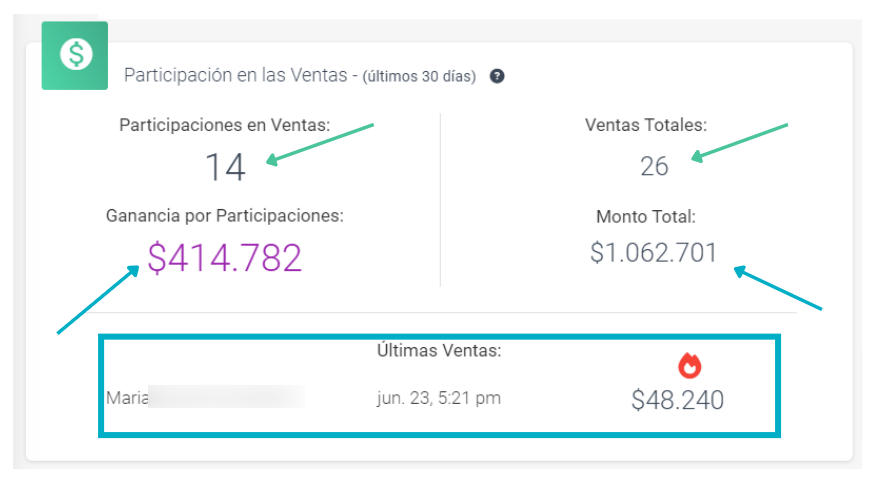
- Similarly, you have access to the main statistic, sales participation. This allows you to see the performance of your notifications and how much of the total sales has been made from them. It reflects the period of the last 30 days. You will be able to see the following in detail:
- Sales participation: number of sales made from an action configured through NotificationButton.
- Total sales: Total sales recorded in your ecommerce.
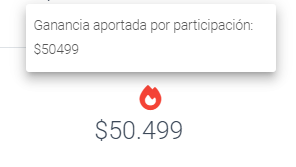
- Profit from participations: amount of profit from sales made based on the participations.
- Total amount: total earnings from the sales made in your ecommerce.
- Latest sales: details of the latest sales made.
- Along with this statistic, you will see a breakdown of the percentage of participation from each channel through which you have sent notifications to your subscribers. This chart also shows you data from the last 30 days:
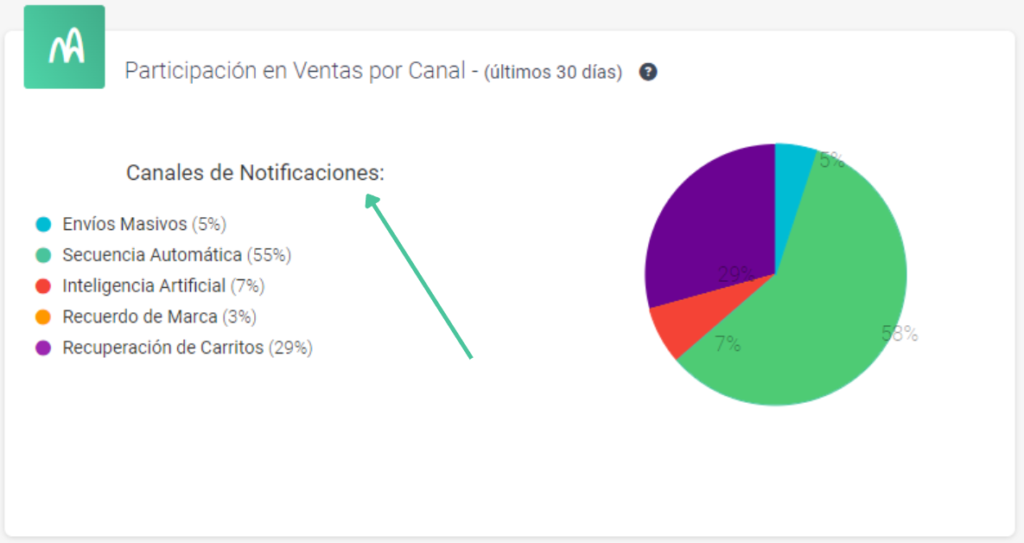
Knowing the performance of your notifications will give you information about which campaigns worked best and help you plan where to focus your goals. You will have a broader view of the areas you can strengthen to find new market opportunities.


